How to Collect Error Details from Your Browser
Last updated:
October 8, 2025
If you see a red “An Error Occurred” message with no other information, follow these steps to capture the technical details for our team.
1. Open Developer Tools
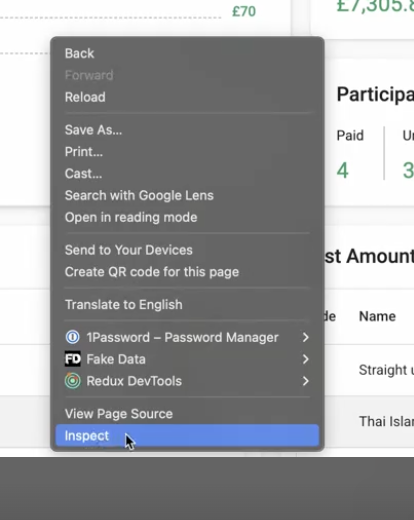
- Right-click anywhere on the page.
- Choose Inspect (or press
Ctrl + Shift + Ion Windows /Cmd + Option + Ion Mac).
2. Switch to the Network Tab
- At the top of the Developer Tools panel, click Network.
- If you don’t see it, click the
»icon to find it in the list.

3. Refresh the Page
- Press F5 or click the Refresh button.
- The Network tab will now start capturing activity.
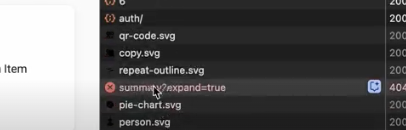
4. Find the Error Request
- Look for any entries in red text — these indicate failed requests (errors).
- Click on the red line that seems related to the action you just tried (e.g. “save”, “submit”, etc.).
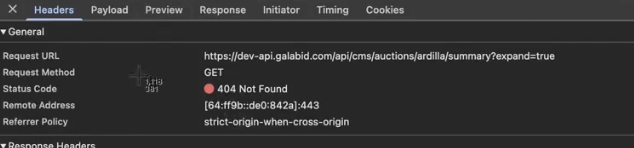
5. Capture the Details
Click on the red request to select it:
- See the General section in the first tab now showing.
- Take a screenshot of the General section.
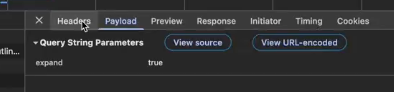
- Click the Payload Tab and Take a screenshot of that as well.
6. Send It to Support
Attach both screenshots to your support ticket or email so our team can identify what went wrong.
